- The USD/JPY price analysis indicates growing concerns about the state of Japan’s economy.
- Trump sent letters to some countries, including Japan and South Korea, notifying them of higher tariffs.
- Some major partners, such as the European Union, may not face higher tariffs.
The USD/JPY price analysis indicates growing concerns about the state of Japan’s economy following Trump’s announcement of a 25% tariff on its goods, effective in August. The move came after the US and Japan failed to reach a deal before the reciprocal tariff deadline. However, Japan seems willing to continue negotiations.
–Are you interested in learning more about Forex indicators? Check our detailed guide-
On Monday, the US president sent letters to some countries, including Japan and South Korea, notifying them of higher tariffs. The move came after the US failed to reach trade agreements with these countries in the 90-day window. However, some major partners, such as the European Union, may not suffer the tariffs since they believe they can reach a deal before the deadline on Wednesday.
Meanwhile, Japan might suffer a 25% levy on its exports to the US starting in August. The US and Japan have held trade talks that, unfortunately, have not yielded a deal. If this remains the case, the export-reliant economy could suffer significantly due to the higher tariffs.
Moreover, it could increase trade tensions between the two countries. Such an outcome would affect both economies. However, there is still hope of a deal before August that could boost relations and revive the sinking yen.
USD/JPY key events today
Traders do not expect any key releases from Japan or the US. Therefore, they will focus on trade developments.
USD/JPY technical price analysis: New swing high confirms bullish trend

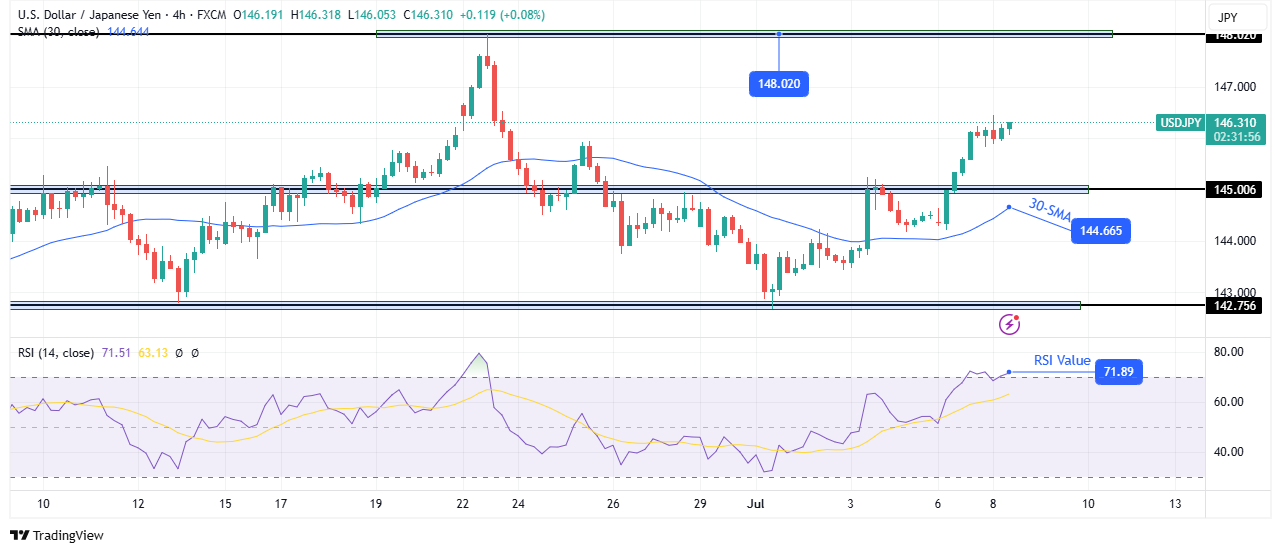
On the technical side, the USD/JPY price has reached new highs after a sharp rally that broke above the key 145.00 resistance level. The new swing occurred after bulls took charge, pushing the price above the 30-SMA. Now the price has made a higher high and low, confirming a new direction. Meanwhile, the RSI trades in the overbought region, indicating solid bullish momentum.
–Are you interested in learning more about Best Bitcoin Exchanges? Check our detailed guide-
However, after such a swing, the price might need to pause and breathe before climbing higher. A deep pullback would retest the 145.00 level or the 30-SMA. If the price stays above the SMA, it will target the 148.02 resistance level. A break above this level would solidify the bullish trend.
Looking to trade forex now? Invest at eToro!
68% of retail investor accounts lose money when trading CFDs with this provider. You should consider whether you can afford to take the high risk of losing your money.


