


The Nasdaq 100 e-mini futures have plummeted by -1.80% in today’s Asian session at this time of the writing, due to a resurgence of risk-off sentiment over Israel’s airstrikes on Iranian nuclear and military targets.
Oil prices spiked by 10% over fears of energy supply disruption in the Strait of Hormuz. A firmer upward drift in the prices of WTI and Brent is likely to complicate the US Federal Reserve’s plan to cut interest rates.
Tighter liquidity conditions may trigger a negative reaction in US stock indices
Based on the latest data from the CME Fed Watch tool, the Fed funds futures market is expecting the Fed to cut the Fed funds rate by 25 basis points (a 98% probability) in the September FOMC meeting to 4.00%-4.25%, its first cut after being on hold since December 2024.
Another “wait and hold” stance by the Fed due to higher oil prices is likely to create a liquidity tightening condition, in turn, triggering a potential negative feedback loop into US stocks, and the higher beta Nasdaq 100 may see a higher magnitude of declines over the S&P 500, and Dow Jones Industrial Average.
Preferred trend bias (1 to 3 days)
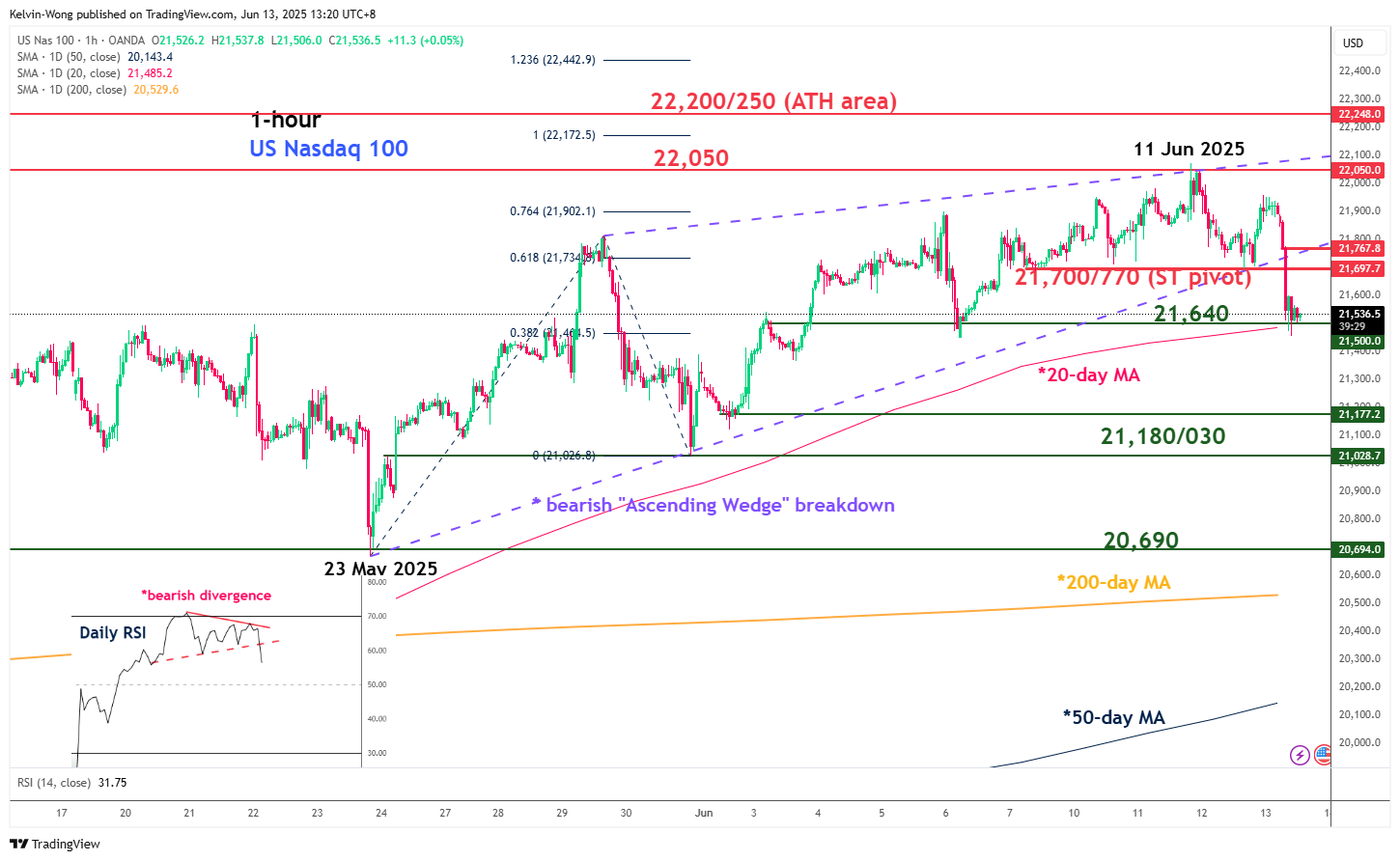
Bearish with key short-term pivotal resistance at 21,700/21,770 for the Nasdaq 100 CFD Index (a proxy of the Nasdaq 100 e-mini futures), and a break below the near-term support at 21,500 (also the 20-day moving average) exposes the next intermediate supports at 21,180/21,030, and 20,690 (close to the 200-day moving average).
Key elements
Today’s price action of the Nasdaq 100 CFD Index has just broken down below a minor bearish “Ascending Wedge” configuration in place since the 23 May 2025 low.
The current intraday loss of -1.7% has wiped out all the gains seen so far this Monday, 9 June, which suggests a potential minor top has been made on 11 June.
The daily RSI momentum indicator has traced out a bearish divergence condition and broken below a key parallel support that supports a likelihood of further weakness in the Nasdaq 100 CFD Index.
Alternative trend bias (1 to 3 days)
On the flip side, a clearance above 21,770 key resistance invalidates the bearish scenario to reinstate the bulls for a retest on the next intermediate resistance at 22,050, and above it sees the all-time high area coming in at 22,200/22,250.
Opinions are the authors’; not necessarily that of OANDA Business Information & Services, Inc. or any of its affiliates, subsidiaries, officers or directors. The provided publication is for informational and educational purposes only.
If you would like to reproduce or redistribute any of the content found on MarketPulse, an award winning forex, commodities and global indices analysis and news site service produced by OANDA Business Information & Services, Inc., please refer to the MarketPulse Terms of Use.
Visit https://www.marketpulse.com/ to find out more about the beat of the global markets.
© 2025 OANDA Business Information & Services Inc.
About the Author

Kelvin Wong
Senior Market Analyst
Based in Singapore, Kelvin Wong is a well-established senior global macro strategist with over 15 years of experience trading and providing market research on foreign exchange, stock markets, and commodities.
Passionate about connecting the dots in the financial markets and sharing perspectives around trading and investment, Kelvin Wong is an expert in using a unique combination of fundamental and technical analyses, specializing in Elliott Wave and fund flow positioning, to pinpoint key reversal levels in the financial markets.
In addition, over the last ten years, Kelvin has conducted numerous market outlook and trading-related seminars, as well as technical analysis training courses, for thousands of retail traders.